November 4, 2019
More Anomalies
Originally published June 23, 2010

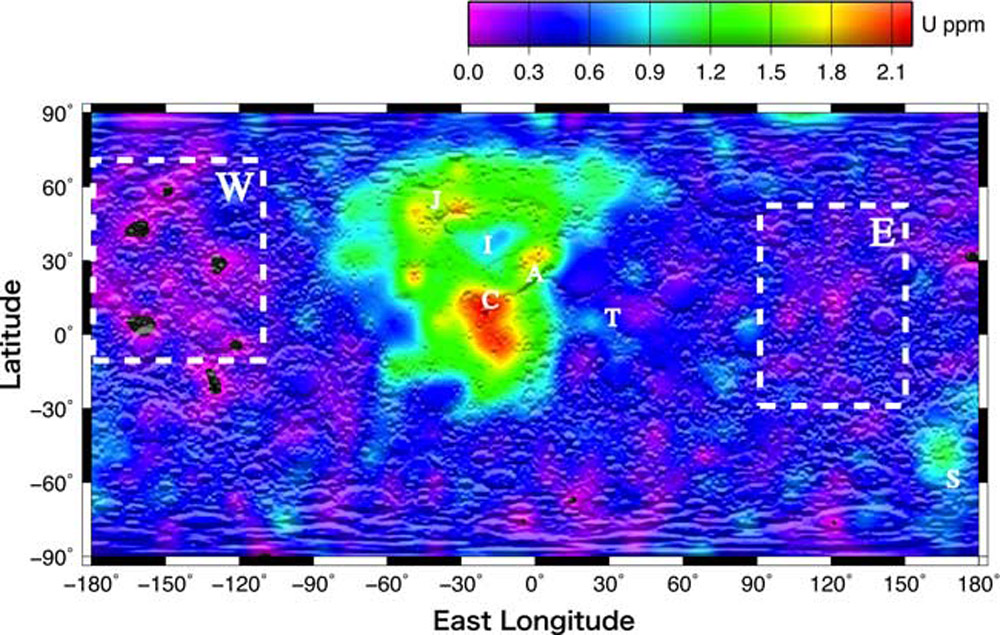
map from Yamashita and colleagues, Geophysical Research Letters
Uranium is not an element that we have had accurate maps of, but data from the gamma ray spectrometer on Kaguya created this high resolution global one. At first glance it looks like the map of thorium distribution, with high values localized to the area of Imbrium toward Nubium that is called Procellarum Kreep Terrain. The similarity is not surprising because thorium and uranium in lunar samples are highly correlated. The high near Copernicus (C) has no explanation that I am aware of other than that it is ejecta from the formation of Imbrium, and if the impact were into a thorium and uranium rich area the ejecta would be enriched. But while other places thickly covered with Imbrium ejecta are green, the Copernicus red is unusual. The fact that the middle of Imbrium is blue, and hence low in uranium, might be interpreted to mean that the pre-Imbrium uranium area was thin and near the surface, and that the deepest parts of Imbrium excavated all the way through it. Yamashita and his team point out that the western (W) portion of the farside is significantly lower in uranium that the east (E) side, implying that highland crust was not all made from the same composition material every where.
Chuck Wood
Yesterday's LPOD: Tantalizing Colors
Tomorrow's LPOD: A Very Tormented Floor
COMMENTS?
Register, Log in, and join in the comments.


