June 23, 2015
A Fundamental Relation
Originally published June 22, 2004
Image Credit: Dick Pike |
|
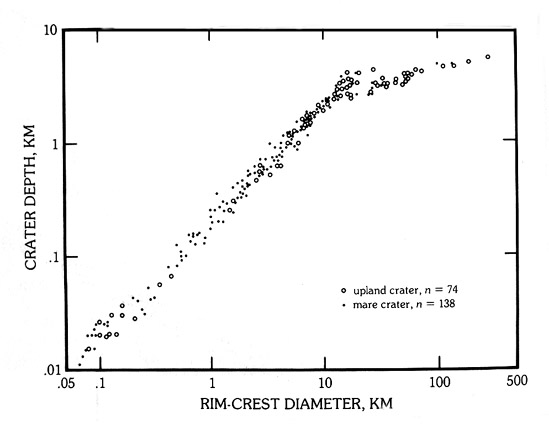
A Fundamental Relation LPOD mostly features images of the Moon accompanied by a tidbit of knowledge. But commonly in science it is a graphical summary of data that tells some of the most important stories. This graph shows the relationship between crater diameter (horizontal axis) and depth (vertical axis) for 212 fresh lunar craters. In the 1970s Dick Pike, a geologist at the US Geological Survey, used Lunar Topographic Orthophotomosaics and other Apollo data to determine the accurate depths of lunar craters. Dick's graph showed that crater depths constantly increased with crater diameters up to diameters of about 15 km. Larger craters increased in depth, but at a slower pace than predicted from small craters. For example, if a 100 km wide crater had the depth extrapolated by the depth-diameter relation for small craters it would be 20 km deep. But a fresh 100 km crater is actually only about 5 km deep. How come? The craters smaller than 15 are called simple craters - they are bowl shaped, just as formed at the instant of impact. Larger craters are complex - they have wall slumps and terraces and central peaks. So one of the reasons craters larger than 15 km are relatively shallow is that they are modified by the formation of terraces and slumps that deposit material on their floors and also increase their diameter. And the formation of central peaks by rebounding of crater floors also shallows complex craters. Technical Details: Related Links: Yesterday's LPOD: Re-Projecting the Moon Tomorrow's LPOD: Concentric Craters |
Author & Editor: |
COMMENTS?
Register, Log in, and join in the comments.


