image by Chris and Roland Behee, Bellingham and Everett, Wa
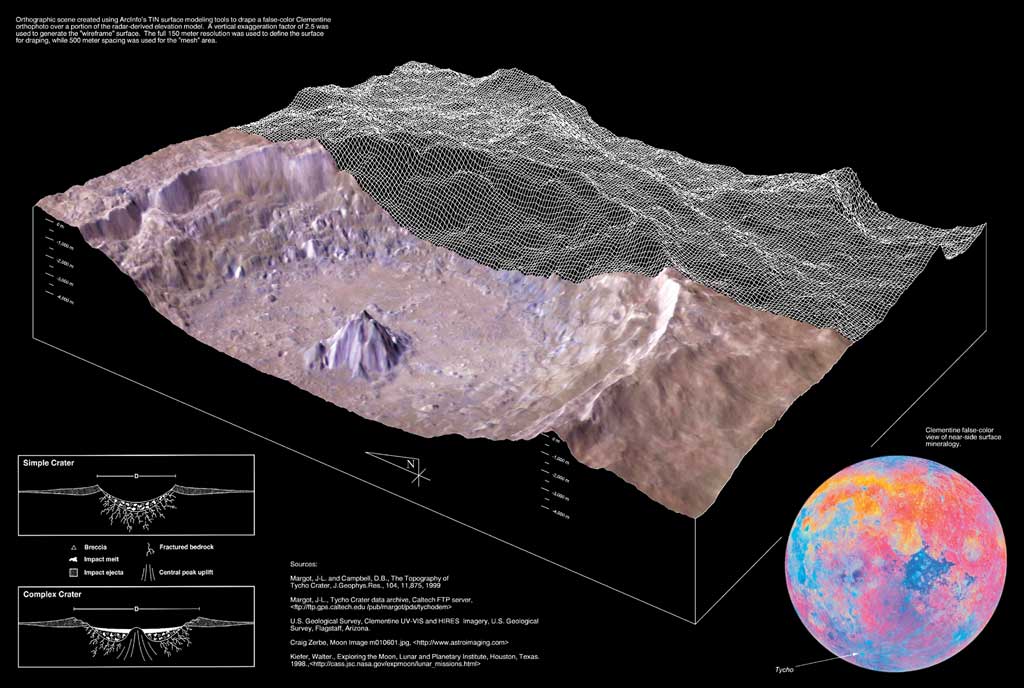
High resolution mapping of the Moon can be obtained in several different ways. Overlapping stereo images allow traditional photogrammetry methods to be used - this is how the LTOs were make from Apollo Pan and Metric photography. The lunar orbiter Clementine carried a laser altimeter that measured the travel time of a pulse of energy from the spacecraft to the Moon and back, from which spot heights were generated. If the spots are close enough together, and of small size, a detailed topographic map can be constructed. The Clementine data aren’t adequate for such high resolution lunar mapping although an excellent topo map of Mars was generated using this technique with Mars Global Surveyor data. A third method is illustrated by this four-year old illustration of Tycho. Here radar images from Goldstone in California were used to produce an elevation model on which Clementine visual images were draped. This image has a vertical exaggeration of 2.5, making Tycho’s central peak look like the steep-sided pinnacles common in artists’ drawings from 50 or more years ago. Once we have excellent digital terrain models for the Moon, many types of maps can be created by draping them with image, gravity, or compositional data.
Related Links:
Rükl chart 64
Image and details fromESRI website
Yesterday's LPOD: How High the Moon - or at Least a Few Peaks
Tomorrow's LPOD: A Straight Line Across the Moon
COMMENTS?
Register, Log in, and join in the comments.


