Difference between revisions of "March 20, 2014"
| Line 3: | Line 3: | ||
<!-- ws:start:WikiTextHeadingRule:0:<h1> --> | <!-- ws:start:WikiTextHeadingRule:0:<h1> --> | ||
<!-- ws:start:WikiTextLocalImageRule:6:<img src="/file/view/LPOD-Mar20-14.jpg/497006060/LPOD-Mar20-14.jpg" alt="" title="" style="width: 1200px;" /> -->[[File:LPOD-Mar20-14.jpg|LPOD-Mar20-14.jpg]]<!-- ws:end:WikiTextLocalImageRule:6 --><br /> | <!-- ws:start:WikiTextLocalImageRule:6:<img src="/file/view/LPOD-Mar20-14.jpg/497006060/LPOD-Mar20-14.jpg" alt="" title="" style="width: 1200px;" /> -->[[File:LPOD-Mar20-14.jpg|LPOD-Mar20-14.jpg]]<!-- ws:end:WikiTextLocalImageRule:6 --><br /> | ||
| − | <em>image by [mailto:jupiter182002@yahoo.ca | + | <em>image by [mailto:jupiter182002@yahoo.ca Maximilian Teodorescu], Dumitrana, Romania</em><br /> |
<br /> | <br /> | ||
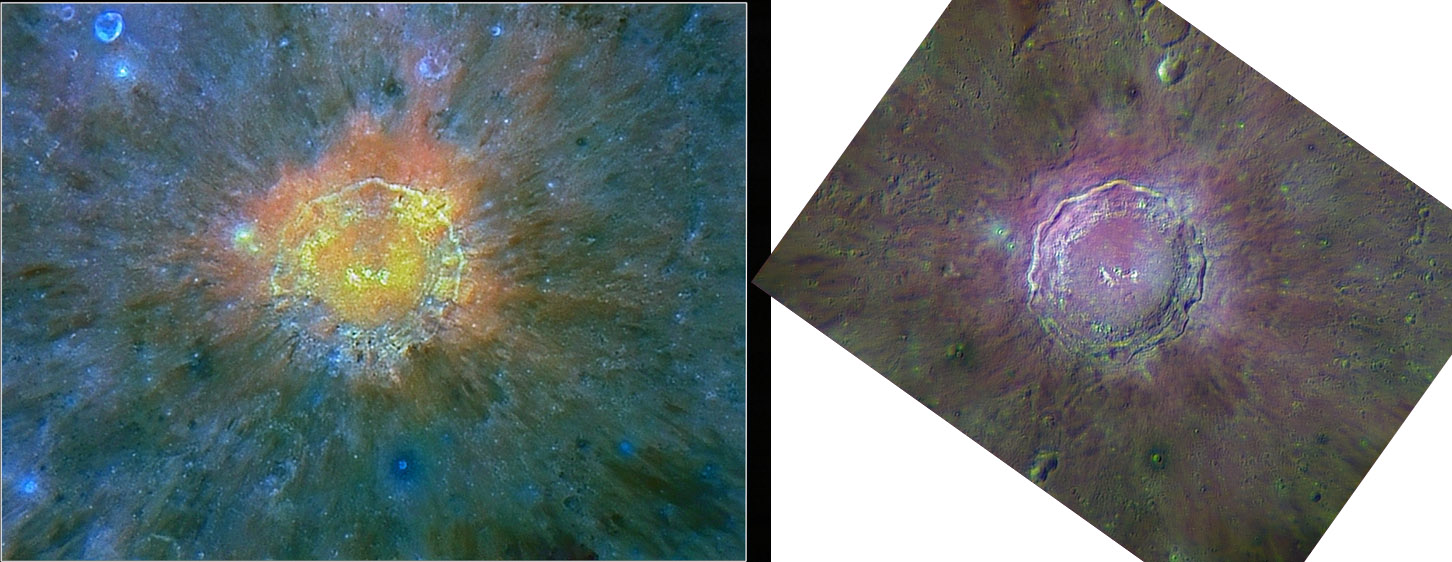
| − | Here are two of Max's experiments with color imaging/processing of Copernicus - details below. Because they use different filters the colors are different some details show better in one than in the other.In both cases the gold and mauve colors map the distribution of impact melt in and around the crater. The broad patch of melt rocks in the upper left quadrant of Copernicus' floor has been [http://www.lpod.org/archive/archive/2004/02/LPOD-2004-02-13.htm | + | Here are two of Max's experiments with color imaging/processing of Copernicus - details below. Because they use different filters the colors are different some details show better in one than in the other.In both cases the gold and mauve colors map the distribution of impact melt in and around the crater. The broad patch of melt rocks in the upper left quadrant of Copernicus' floor has been [http://www.lpod.org/archive/archive/2004/02/LPOD-2004-02-13.htm known] at east since the Clementine color mosaics. The gold image does not delineate the melt quadrant as clearly as the mauve image, nor the Clementine one, but all of them show the brightest melt deposit beyond the rim on that same northwest quarter. Although melt was distributed all around Copernicus, the greatest concentration in to the N, NE and weakest is to the south. I was going to say that this suggests an oblique impact, but then I see that I already said [http://www.lpod.org/archive/archive/2004/02/LPOD-2004-02-13.htm that] ten years ago! Its hard to keep up with LPOD. The gold image does show something that is difficult to see on the other images. Dark spots occur on the southern wall, with some elongated ones looking like flows. It is hard to match them exactly with [http://bit.ly/1gIxiMX LRO], but these are in an area where distinct flows of impact melt are visible, rather than diffuse melt covering. <br /> |
<br /> | <br /> | ||
| − | <em>[mailto:tychocrater@yahoo.com | + | <em>[mailto:tychocrater@yahoo.com Chuck Wood]</em><br /> |
<br /> | <br /> | ||
<strong>Technical Details</strong><br /> | <strong>Technical Details</strong><br /> | ||
| Line 15: | Line 15: | ||
<strong>Related Links</strong><br /> | <strong>Related Links</strong><br /> | ||
<em>[http://lpod.wikispaces.com/21st+Century+Atlas+of+the+Moon 21st Century Atlas]</em> charts 17 & 22.<br /> | <em>[http://lpod.wikispaces.com/21st+Century+Atlas+of+the+Moon 21st Century Atlas]</em> charts 17 & 22.<br /> | ||
| − | Max's [http://maximusphotography.wordpress.com/ | + | Max's [http://maximusphotography.wordpress.com/ blog].<br /> |
<hr /> | <hr /> | ||
Revision as of 20:05, 17 January 2015
Mauve And Gold

image by Maximilian Teodorescu, Dumitrana, Romania
Here are two of Max's experiments with color imaging/processing of Copernicus - details below. Because they use different filters the colors are different some details show better in one than in the other.In both cases the gold and mauve colors map the distribution of impact melt in and around the crater. The broad patch of melt rocks in the upper left quadrant of Copernicus' floor has been known at east since the Clementine color mosaics. The gold image does not delineate the melt quadrant as clearly as the mauve image, nor the Clementine one, but all of them show the brightest melt deposit beyond the rim on that same northwest quarter. Although melt was distributed all around Copernicus, the greatest concentration in to the N, NE and weakest is to the south. I was going to say that this suggests an oblique impact, but then I see that I already said that ten years ago! Its hard to keep up with LPOD. The gold image does show something that is difficult to see on the other images. Dark spots occur on the southern wall, with some elongated ones looking like flows. It is hard to match them exactly with LRO, but these are in an area where distinct flows of impact melt are visible, rather than diffuse melt covering.
Chuck Wood
Technical Details
Gold image: Composed of two images from different dates: color data: September 2, 2012. C11@F10, DBK 41 AU02.AS and IR-pass 685nm filter. The higher resolution data: September 29, 2012. C 11, 2.25x barlow, DBK 41 AU02.AS, IR-pass 685nm filter.
Mauve image: March 13, 2014 20:44 U.T. C11@F/20, ASI120MM, Baader RGB filters. The image is LRGB with Luminance from the Red channel. Seeing 4-5/10. 1500 frames per channel.
Related Links
21st Century Atlas charts 17 & 22.
Max's blog.


