August 23, 2018
Color of History
Originally published June 10, 2009

USGS Geologic Atlas of the Moon, eastern map now available at LPI Lunar Maps Collection
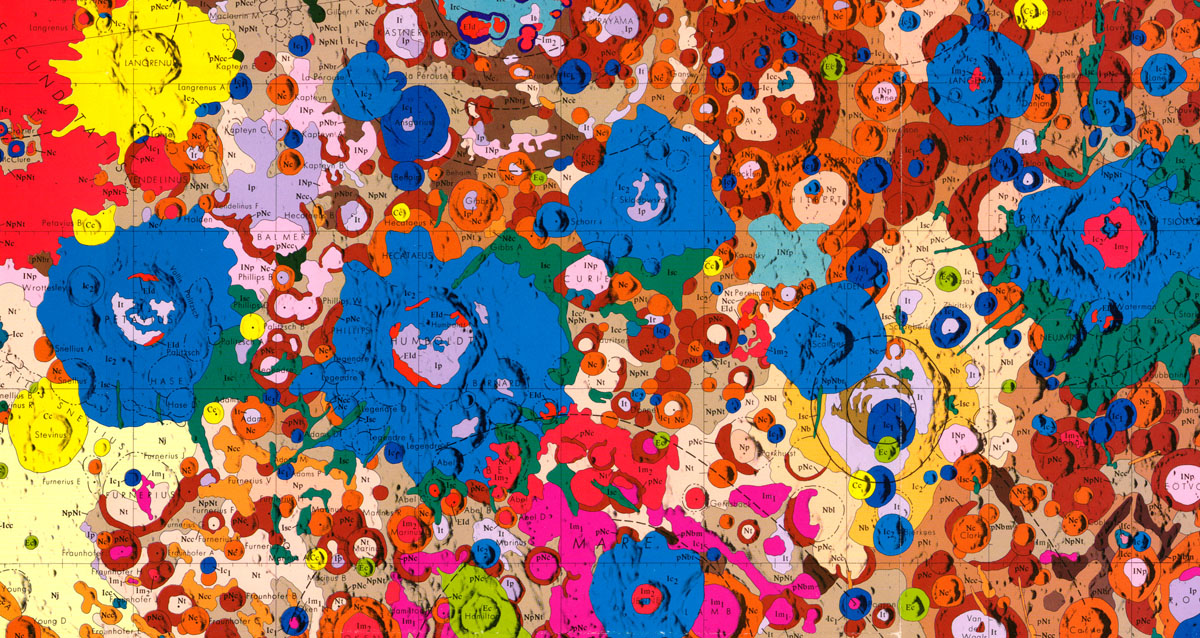
Is this the most colorful map of the Moon ever made? It is one of the relics of the era of Apollo.
In the early 60s the US Geological Survey started investigating the geologic history of the Moon
by mapping the relative positions of ejecta from each crater. Survey mappers have identified five
different eras of lunar history, denoted on these maps by vibrant colors. Yellow, as used to map
Langrenus at upper left, represents the newest or Copernican craters. Hamilton,mapped as pea
green at bottom center, is the next youngest age, Eratosthenian. In shades of blue (Petavius and
Humboldt) are craters of Imbrian age - they formed during the period of massive mare basalt
eruptions about 3.5 billion years ago. The oranges (Vendelinus) are materials formed at the time
of the Nectaris Basin, and the browns are the oldest features, called Pre-Nectarian. Since these
maps were made there have been a few changes of classifications (Langrenus is now considered
to be Eratosthenian), but the basic system is still used widely. So when you observe the Moon, see
if you can glimpse these stratigraphic colors.
Chuck Wood
Related Links
Rükl plate 39
Yesterday's LPOD: Impact Alert
Tomorrow's LPOD: Peaking Over the Limb
COMMENTS?
Register, Log in, and join in the comments.


