May 16, 2011
Detailed Mapping of Lavas of Different Colors

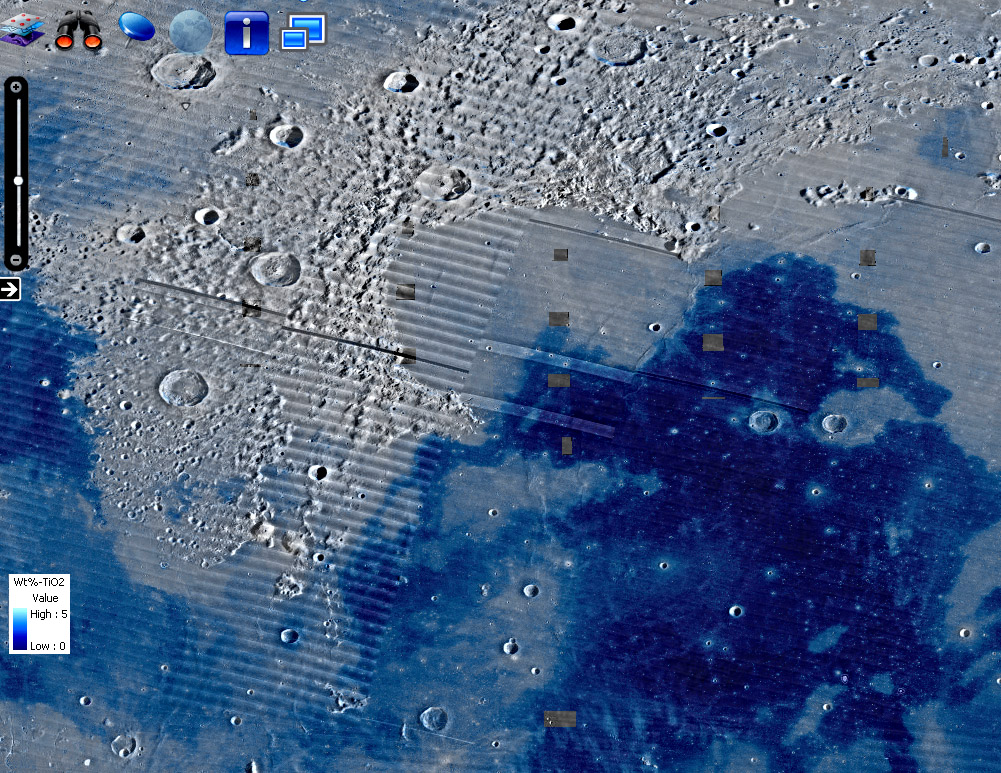
image constructed with Browse of the NASA Lunar Mapping and Modelling Project
NASA's Marshall Space Center has released a suite of image tools - Lunar Mapping and Modelling Project - for displaying lunar data. There are actually three different tools, with overlapping and different features. I am just beginning to learn the default one that appears to be called Browse. It is a Flash application and will not work on an iPad, but does on both PCs and Macs. The image above was created with Browse, by selecting a Lunar Orbiter mosaic as the base layer and superposing titanium abundance derived from Clementine. The source for the low titanium (dark blue) lava flows is near the bottom center of the image, and the lavas flowed down a gentle slope over older mare lavas (gray) towards the center of the Imbrium Basin. Almost streamlined islands of slightly higher older material are visible near bottom right, and Helicon's ejecta is local high ground, while Le Verrier occupies the western end of an elevated area. The large mare ridges from the Straight Range to Prom. Laplace westward were tall enough to stop the flow of the blue lavas, but the flows overtopped lower ridges extending towards Prom. Heraclides and flowed into Sinus Iridum. The ability to drape geochemical data over low Sun images will permit studies of the interactions of flows with topography, and help judge temporal relationships of flows, rilles and ridges. There are some obvious improvements that will hopefully be coming to this new product, including the addition of the LRO WAC mosaic as a background layer. I'd also like the image to be a rotatable globe so that any spot can be seen from directly overhead, without foreshortening. Another useful feature would be to click any spot to find its elevation, titanium abundance, etc, just as now you can see latitude, longitude and Sun angle for each pixel. Perhaps the other two tools - Integrated Lunar Information Architecture for Decision Support (ILIADS) and the simpler named Lunar Mapper - have such functionalities, but they are for another day.
Chuck Wood
Note: The little rectangular images appear with the titanium data set and I haven't found a switch to turn them off (see comments).
Related Links
Rükl plate 10
Yesterday's LPOD: Little but Good
Tomorrow's LPOD: Still the Best
COMMENTS?
Register, Log in, and join in the comments.


