image courtesy Tommy Thompson and Bruce Campbell
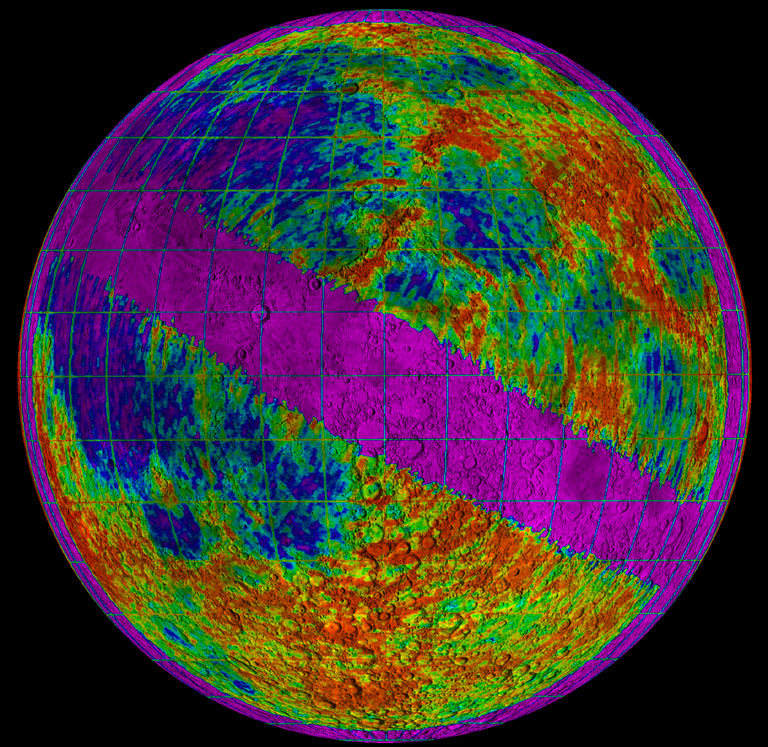
This is a radar map of the Moon at 7.5-meter wavelength, the longest wavelength used so far for lunar remote sensing. Orthographic projection with north at top; the background is the USGS shaded relief map. Cooler colors correspond to lower echo strength, while orange and red tones correspond to strong radar reflections. The purple belt across the moon from southeast to northwest is the “Doppler Equator”, where no useful delay-Doppler resolution is obtained. Overall, the maria backscatter less power than the highlands by a factor of 1.5-to-1, similar to mare-terra differences seen at meter wavelengths. One exception is that the Montes Jura along the northern rim of the Imbrium basin have the same backscatter as the maria. Large rayed craters like Tycho have strong enhancements relative to their environs due to wavelength-sized scatterers (rocks and blocks with sizes of 3 m and larger on the surface or buried within 75 m of the surface. A 7-m rock was visited by Harrison (Jack) Schmitt at the Apollo 17 landing site. These data were obtained in the late 1970’s with the second application of delay-Doppler interferometry to radar mapping of solar system objects (following the pioneering application of this to the radar mapping of Venus by Alan Rodgers of MIT). The resolution was 35-50 km, about the same as the very first Arecibo delay-Doppler maps of the Moon obtained in 1964. The optimum baseline for these lunar observations placed the second antenna some 580 meters north of the main dish at Arecibo, just within the Cornell property lines! This ancillary antenna was a simple ham radio Yagi antenna with a 40-degree beam-width that matched the tracking limits of the main 1000-foot Arecibo antenna. Europeans who came to Arecibo to experiment with artificial heating of the ionosphere provided the transmitter. All in all, the measurements were a happy coincidence of a number of technical capabilities.
Tommy Thompson and Bruce Campbell
Technical Details:
Comment by CAW: Red colors occur where large boulders 7m or so in size scatter - or reflect - transmitted radar energy back to Earth. The highlands are seen to be full of large boulders, and the maria aren’t; the recent flows in the center of Imbrium are even smoother.
Related Links:
High-resolution lunar radar map at 7.5 meter wavelength, T.W. Thompson,” Icarus, Vol. 36, pp. 174-188, 1978.
Radar probing of planetary regoliths: An example from the northern rim of Imbrium basin Thompson et al, Journal of Geophysical Research, Volume 111, Issue E6, CiteID E06S14.
Christmas is coming - consider leaving a list of lunar books on top of a spouse’s pillow - just make sure you include the LPOD URL so that you support LPOD when buying lunar books (or ANY book) from Amazon!
COMMENTS?
Click on this icon File:PostIcon.jpg at the upper right to post a comment.


