Difference between revisions of "November 2, 2009"
| Line 1: | Line 1: | ||
__NOTOC__ | __NOTOC__ | ||
=What Lunar Scientists Do= | =What Lunar Scientists Do= | ||
| − | |||
<!-- ws:start:WikiTextHeadingRule:0:<h1> --> | <!-- ws:start:WikiTextHeadingRule:0:<h1> --> | ||
<!-- ws:start:WikiTextLocalImageRule:6:<img src="/file/view/LPOD-Nov2-09.jpg/99348739/LPOD-Nov2-09.jpg" alt="" title="" /> -->[[File:LPOD-Nov2-09.jpg|LPOD-Nov2-09.jpg]]<!-- ws:end:WikiTextLocalImageRule:6 --><br /> | <!-- ws:start:WikiTextLocalImageRule:6:<img src="/file/view/LPOD-Nov2-09.jpg/99348739/LPOD-Nov2-09.jpg" alt="" title="" /> -->[[File:LPOD-Nov2-09.jpg|LPOD-Nov2-09.jpg]]<!-- ws:end:WikiTextLocalImageRule:6 --><br /> | ||
| − | <em>image from [http://adsabs.harvard.edu/abs/2008JGRE..11301002K Kramer, Jolliff & Neal]</em><br /> | + | <em>image from [http://adsabs.harvard.edu/abs/2008JGRE..11301002K" rel="nofollow Kramer, Jolliff & Neal]</em><br /> |
<br /> | <br /> | ||
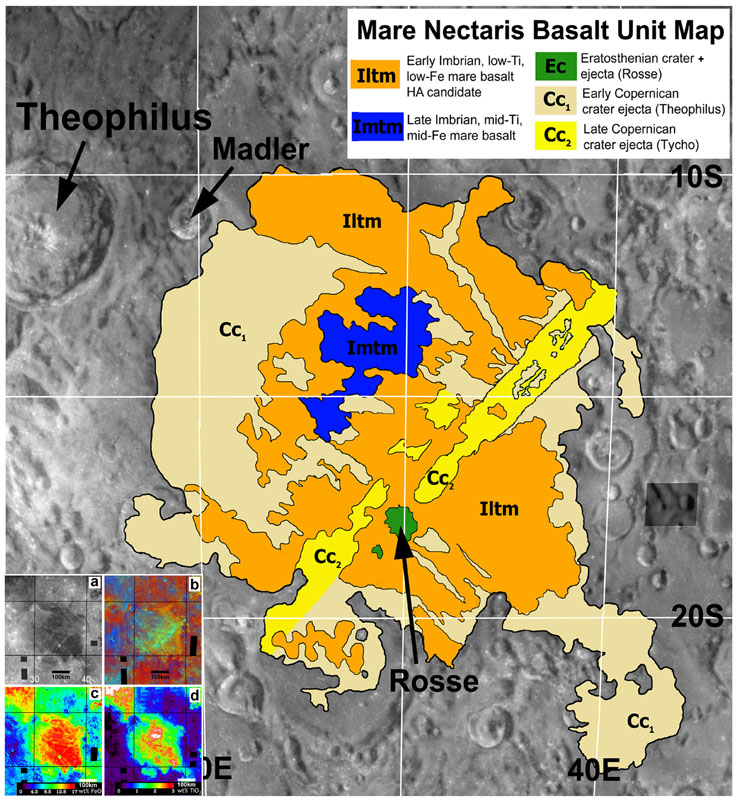
| − | Except for rare [http://lpod.wikispaces.com/October+25,+2009 exceptions], amateur and professional students of the Moon do different things. Backyard observers are excellent at acquiring high resolution images under various illumination conditions. Professional observers don't bother to obtain normal images, relying on high resolution spacecraft views. They do use images taken through filters that isolate different parts of the electromagnetic spectrum to try to identify chemical compositions of lunar materials. This example shows the tools and the result. The four tiny images compressed in the corner are miniaturized versions of Clementine multispectral images that were processed, in the bottom two views, to estimate iron (Fe) and titanium (Ti) abundances in the soils. Variations of these two elements are useful for classifying lunar mare rocks. The result is a map, in this case of Mare Nectaris, showing the interpreted materials. This is a geologically simple mare with most (orange) lavas being low Ti and low Fe basalt erupted in the [http://www.lpod.org/archive/archive/2004/02/LPOD-2004-02-23.htm early Imbrian] period of widespread volcanic activity. These are interpreted to be relatively high aluminum basalts, only sparingly sampled during Apollo missions. A smaller amount of younger basalt (blue) with intermediate abundances of Ti and Fe occurs west of center of the basin, perhaps in a low area. The only other interpreted deposits are ejecta from three impact events - from Rosse, during the Erastosthian period, Theophilus in early Copernican time, and Tycho's rays from late Copernican time. The spectral study confirms that the Nectaris-crossing ray isn't from Rosse - it would have a very weird geometry - but from Tycho.<br /> | + | Except for rare [http://lpod.wikispaces.com/October+25,+2009 exceptions], amateur and professional students of the Moon do different things. Backyard observers are excellent at acquiring high resolution images under various illumination conditions. Professional observers don't bother to obtain normal images, relying on high resolution spacecraft views. They do use images taken through filters that isolate different parts of the electromagnetic spectrum to try to identify chemical compositions of lunar materials. This example shows the tools and the result. The four tiny images compressed in the corner are miniaturized versions of Clementine multispectral images that were processed, in the bottom two views, to estimate iron (Fe) and titanium (Ti) abundances in the soils. Variations of these two elements are useful for classifying lunar mare rocks. The result is a map, in this case of Mare Nectaris, showing the interpreted materials. This is a geologically simple mare with most (orange) lavas being low Ti and low Fe basalt erupted in the [http://www.lpod.org/archive/archive/2004/02/LPOD-2004-02-23.htm" rel="nofollow early Imbrian] period of widespread volcanic activity. These are interpreted to be relatively high aluminum basalts, only sparingly sampled during Apollo missions. A smaller amount of younger basalt (blue) with intermediate abundances of Ti and Fe occurs west of center of the basin, perhaps in a low area. The only other interpreted deposits are ejecta from three impact events - from Rosse, during the Erastosthian period, Theophilus in early Copernican time, and Tycho's rays from late Copernican time. The spectral study confirms that the Nectaris-crossing ray isn't from Rosse - it would have a very weird geometry - but from Tycho.<br /> |
<br /> | <br /> | ||
| − | <em>[mailto:tychocrater@yahoo.com Chuck Wood]</em><br /> | + | <em>[mailto:tychocrater@yahoo.com" rel="nofollow Chuck Wood]</em><br /> |
<br /> | <br /> | ||
<strong>Technical Details</strong><br /> | <strong>Technical Details</strong><br /> | ||
| − | The processing and interpretation of the images is described in Georgiana Y. Kramer, Bradley L. Jolliff, and Clive R. Neal (2008) "[http://adsabs.harvard.edu/abs/2008JGRE..11301002K Distinguishing high-alumina mare basalts using Clementine UVVIS and Lunar Prospector GRS data: Mare Moscoviense and Mare Nectaris]", <em>JOURNAL OF GEOPHYSICAL RESEARCH, VOL. 113</em>, E01002, doi:10.1029/2006JE002860<br /> | + | The processing and interpretation of the images is described in Georgiana Y. Kramer, Bradley L. Jolliff, and Clive R. Neal (2008) "[http://adsabs.harvard.edu/abs/2008JGRE..11301002K" rel="nofollow Distinguishing high-alumina mare basalts using Clementine UVVIS and Lunar Prospector GRS data: Mare Moscoviense and Mare Nectaris]", <em>JOURNAL OF GEOPHYSICAL RESEARCH, VOL. 113</em>, E01002, doi:10.1029/2006JE002860<br /> |
<br /> | <br /> | ||
<strong>Related Links</strong><br /> | <strong>Related Links</strong><br /> | ||
Revision as of 18:14, 4 January 2015
What Lunar Scientists Do

image from " rel="nofollow Kramer, Jolliff & Neal
Except for rare exceptions, amateur and professional students of the Moon do different things. Backyard observers are excellent at acquiring high resolution images under various illumination conditions. Professional observers don't bother to obtain normal images, relying on high resolution spacecraft views. They do use images taken through filters that isolate different parts of the electromagnetic spectrum to try to identify chemical compositions of lunar materials. This example shows the tools and the result. The four tiny images compressed in the corner are miniaturized versions of Clementine multispectral images that were processed, in the bottom two views, to estimate iron (Fe) and titanium (Ti) abundances in the soils. Variations of these two elements are useful for classifying lunar mare rocks. The result is a map, in this case of Mare Nectaris, showing the interpreted materials. This is a geologically simple mare with most (orange) lavas being low Ti and low Fe basalt erupted in the " rel="nofollow early Imbrian period of widespread volcanic activity. These are interpreted to be relatively high aluminum basalts, only sparingly sampled during Apollo missions. A smaller amount of younger basalt (blue) with intermediate abundances of Ti and Fe occurs west of center of the basin, perhaps in a low area. The only other interpreted deposits are ejecta from three impact events - from Rosse, during the Erastosthian period, Theophilus in early Copernican time, and Tycho's rays from late Copernican time. The spectral study confirms that the Nectaris-crossing ray isn't from Rosse - it would have a very weird geometry - but from Tycho.
" rel="nofollow Chuck Wood
Technical Details
The processing and interpretation of the images is described in Georgiana Y. Kramer, Bradley L. Jolliff, and Clive R. Neal (2008) "" rel="nofollow Distinguishing high-alumina mare basalts using Clementine UVVIS and Lunar Prospector GRS data: Mare Moscoviense and Mare Nectaris", JOURNAL OF GEOPHYSICAL RESEARCH, VOL. 113, E01002, doi:10.1029/2006JE002860
Related Links
Rükl plate 58


