Difference between revisions of "February 8, 2004"
| Line 1: | Line 1: | ||
__NOTOC__ | __NOTOC__ | ||
=Crazy Quilt Imbrium= | =Crazy Quilt Imbrium= | ||
| + | <!-- Start of content --> | ||
<table width="640" border="0" align="center" cellpadding="6" cellspacing="2"> | <table width="640" border="0" align="center" cellpadding="6" cellspacing="2"> | ||
<tr> | <tr> | ||
| Line 61: | Line 62: | ||
</table> | </table> | ||
<p> </p> | <p> </p> | ||
| + | <!-- End of content --> | ||
{{wiki/ArticleFooter}} | {{wiki/ArticleFooter}} | ||
Latest revision as of 18:11, 7 February 2015
Crazy Quilt Imbrium
Image Credit: Jeff Gillis |
|
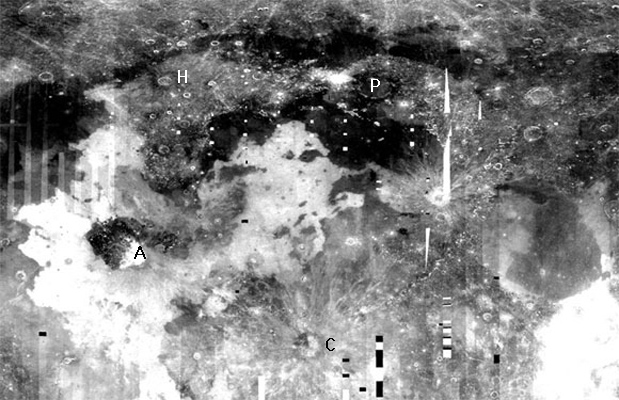
Crazy Quilt Imbrium Are you lost looking at this image? Its our Moon, but as seen through very odd spectral glasses. To help get your bearings I've labeled some craters: A = Aristarchus, C = Copernicus, H = Harpalus, P = Plato; you can figure out the rest! The Clementine spacecraft imaged the Moon in 11 wavelengths, including 6 in the near infrared. As an aside: The NIR images have finally been calibrated so they can be used to identify various elements and minerals. Jeff Gillis and Paul Lucey used this data to search for evidence of water-bearing minerals. Alas, they found none (including at Reiner Gamma which is sometimes interpreted as a comet impact). They did, however, find that a resultant image made by ratioing images acquired in the visible and red regions of the spectrum dramatically distinguishes many different lava flows, presumably with different compositions. Some of these flows - such as the bright one in the middle of Imbrium - are well known, but others have never before been delineated so carefully. It is remarkable that amateur images with commercial digital cameras can pick up some of these flows. I bet that digital imaging through color filters could approach this Clementine derived image in detecting lava flows with only subtle color differences. Who will be first to try it? Technical Details: Related Links: Yesterday's LPOD: Crumpled Sheets of Lava Tomorrow's LPOD: Seeing Double: Pythagoras |
|
Author & Editor: |
COMMENTS?
Register, Log in, and join in the comments.


