Difference between revisions of "June 21, 2009"
| Line 3: | Line 3: | ||
<!-- ws:start:WikiTextHeadingRule:2:<h1> --> | <!-- ws:start:WikiTextHeadingRule:2:<h1> --> | ||
<!-- ws:start:WikiTextLocalImageRule:8:<img src="/file/view/LPOD-June21-09.jpg/78886977/LPOD-June21-09.jpg" alt="" title="" /> -->[[File:LPOD-June21-09.jpg|LPOD-June21-09.jpg]]<!-- ws:end:WikiTextLocalImageRule:8 --><br /> | <!-- ws:start:WikiTextLocalImageRule:8:<img src="/file/view/LPOD-June21-09.jpg/78886977/LPOD-June21-09.jpg" alt="" title="" /> -->[[File:LPOD-June21-09.jpg|LPOD-June21-09.jpg]]<!-- ws:end:WikiTextLocalImageRule:8 --><br /> | ||
| − | <em>image by [http://www.nasa.gov/topics/moonmars/features/moon-20090618.html | + | <em>image by [http://www.nasa.gov/topics/moonmars/features/moon-20090618.html NASA JPL]</em><br /> |
<br /> | <br /> | ||
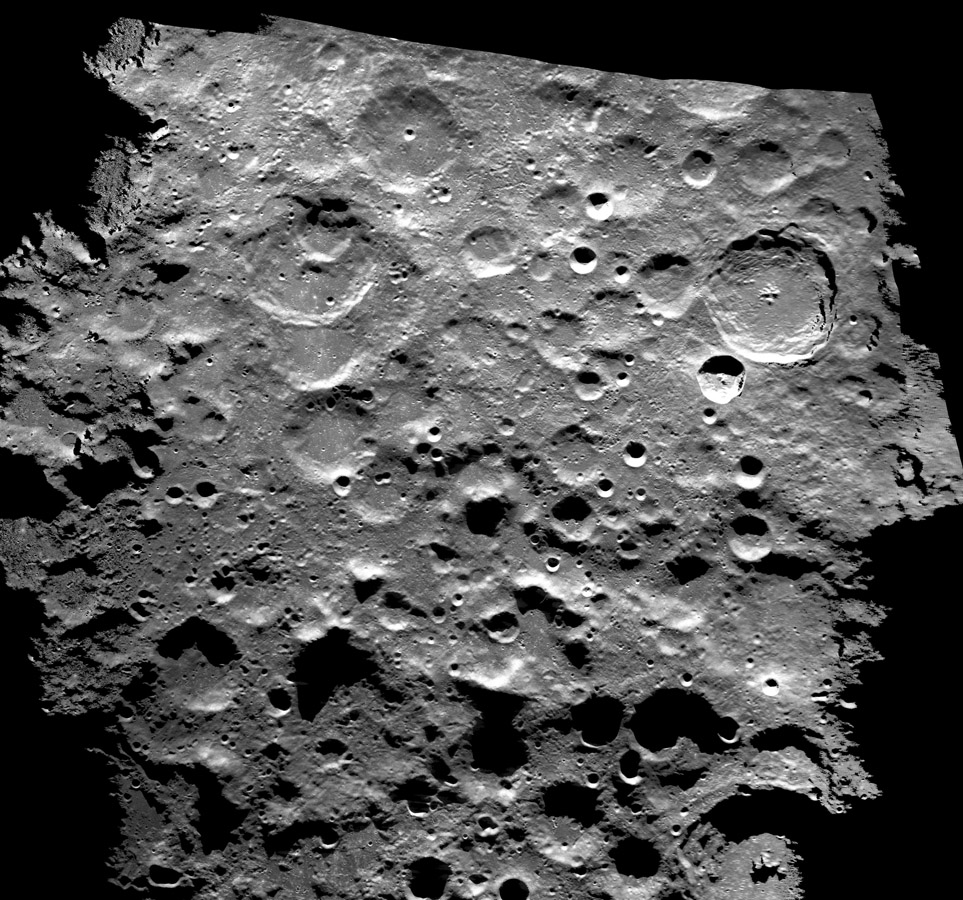
| − | With the LCROSS collisional duo enroute to impact the South Pole area on October 9, NASA has released a new image map to provide better knowledge of where it is going. This image and accompanying topo map were made by bouncing 90 minute long radar pulses off the Moon and accurately measuring their ~2.5 second two way travel time. Frankly, I don't know why the image and topo map were released because the new topo [http://www.nasa.gov/topics/moonmars/features/moon-20090618.html | + | With the LCROSS collisional duo enroute to impact the South Pole area on October 9, NASA has released a new image map to provide better knowledge of where it is going. This image and accompanying topo map were made by bouncing 90 minute long radar pulses off the Moon and accurately measuring their ~2.5 second two way travel time. Frankly, I don't know why the image and topo map were released because the new topo [http://www.nasa.gov/topics/moonmars/features/moon-20090618.html map] is almost identical to what JPL released on [http://lpod.wikispaces.com/February+28,+2008 Feb 27, 2008] made with the same Goldstone radar antennas. The press release for the new image say it's 40 m resolution is the highest ever for this region, but the 2008 image was said to be 20 m resolution. In any case, this map will have a short lifetime because the altimeter, camera and radar on LRO will be used to produce a higher quality image map. If this region were not at the south pole no one would consider going there. It is ancient terrain lacking lava flows or pyroclastic deposits, and the main geology of interest are the peaks that define the ring of the South Pole - Aitken basin. What the pole offers are logistical more than scientific advantages - near continuous solar power, less extreme daytime temperatures and the possibly - hopefully to be determined with certainty by LRO and LCROSS - of easily mined (excepting the extraordinarily low temperature) water in permanently shaded craters. But LRO will be much more than the poles so no matter what is found there, as the LRO and Kaguya data are mined and combined, we should have a quantum leap of characterizing the most beloved object in the sky.<br /> |
<br /> | <br /> | ||
| − | <em>[mailto:tychocrater@yahoo.com | + | <em>[mailto:tychocrater@yahoo.com Chuck Wood]</em><br /> |
<br /> | <br /> | ||
<strong>Technical Details</strong><br /> | <strong>Technical Details</strong><br /> | ||
| − | Nomenclature annotations appear on [http://lpod.wikispaces.com/February+28,+2008 LPOD's version] of the [http://science.nasa.gov/headlines/y2008/29feb_radarmoon.htm | + | Nomenclature annotations appear on [http://lpod.wikispaces.com/February+28,+2008 LPOD's version] of the [http://science.nasa.gov/headlines/y2008/29feb_radarmoon.htm earlier] radar image.<br /> |
<br /> | <br /> | ||
<strong>Related Links</strong><br /> | <strong>Related Links</strong><br /> | ||
Revision as of 17:59, 17 January 2015
Pole 2.0

image by NASA JPL
With the LCROSS collisional duo enroute to impact the South Pole area on October 9, NASA has released a new image map to provide better knowledge of where it is going. This image and accompanying topo map were made by bouncing 90 minute long radar pulses off the Moon and accurately measuring their ~2.5 second two way travel time. Frankly, I don't know why the image and topo map were released because the new topo map is almost identical to what JPL released on Feb 27, 2008 made with the same Goldstone radar antennas. The press release for the new image say it's 40 m resolution is the highest ever for this region, but the 2008 image was said to be 20 m resolution. In any case, this map will have a short lifetime because the altimeter, camera and radar on LRO will be used to produce a higher quality image map. If this region were not at the south pole no one would consider going there. It is ancient terrain lacking lava flows or pyroclastic deposits, and the main geology of interest are the peaks that define the ring of the South Pole - Aitken basin. What the pole offers are logistical more than scientific advantages - near continuous solar power, less extreme daytime temperatures and the possibly - hopefully to be determined with certainty by LRO and LCROSS - of easily mined (excepting the extraordinarily low temperature) water in permanently shaded craters. But LRO will be much more than the poles so no matter what is found there, as the LRO and Kaguya data are mined and combined, we should have a quantum leap of characterizing the most beloved object in the sky.
Chuck Wood
Technical Details
Nomenclature annotations appear on LPOD's version of the earlier radar image.
Related Links
Rükl plate 73, V & VI


