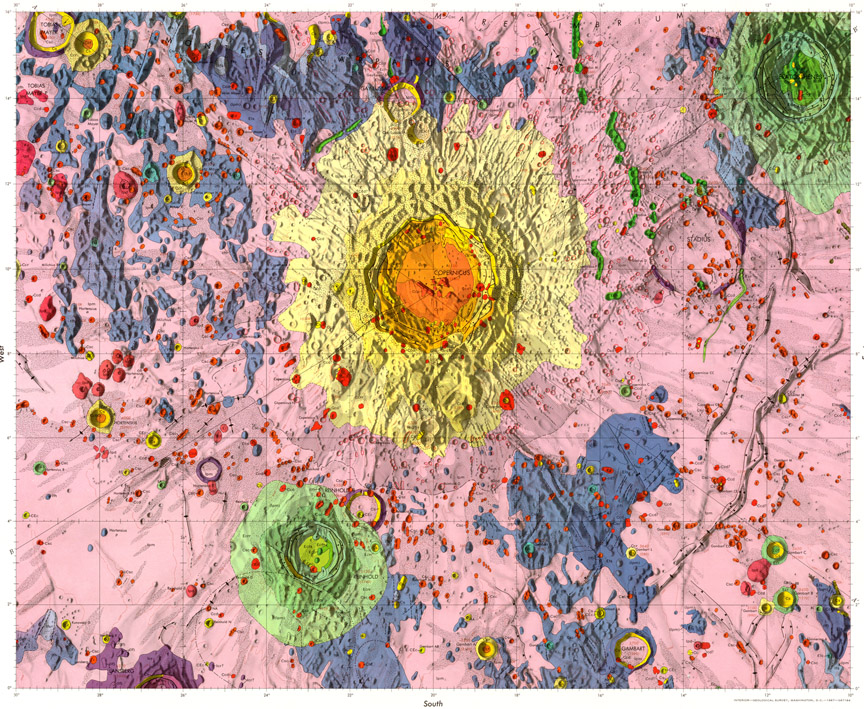
USGS Map I-515 by HH Schmidt, NJ Trask and EM Shoemaker
Geologic maps attempt to graphically depict the history of a landscape. Forty years ago the U.S. Geologic Survey (led by Gene Shoemaker) applied geologic mapping to the Moon, and one of the first quadrangles mapped was this one centered on Copernicus. To understand an area’s history it was necessary to determine the relative age of every visible landform. For example, Copernicus’ ejecta (yellow) and rays (light gray) cover the surrounding mare (pink), therefore Copernicus must be younger than the mare. Eratosthenes and Reinhold (both green) are draped by the rays of Copernicus, but their ejecta cover the nearby maria - those craters must be older than Copernicus, but younger than the mare. Some rough terrain (blue) is embayed by the mare and thus was there before the lavas flowed across the landscape. The small orange craters are distributed around Copernicus and are secondary craters, A few small red craters are superposed on Copernicus and its ejecta and are younger impact craters. And to the west (left) are some oval hills colored dark pink - they are volcanic domes. I encourage you to try your hand at deciphering the geologic history of a piece of the Moon and to make a map, which forces careful study of the relationships of every landforms. And when you are done you can compare your interpretation with those made by USGS mappers in the 1960s, all conveniently preserved at the Lunar & Planetary Institute.
Technical Details:
Geologic mapping was done using the Photographic Lunar Atlas pictures complemented by visual observing with the Lowell 24″ refractor.
Related Links:
Rükl chart 31
Yesterday's LPOD: Layers of History
Tomorrow's LPOD: Draped Landscapes
COMMENTS?
Register, Log in, and join in the comments.


