Difference between revisions of "November 12, 2009"
(Created page with "__NOTOC__ =A Tidal Wave of Access - Almost= <!-- ws:start:WikiTextHeadingRule:0:<h1> --> <!-- ws:start:WikiTextLocalImageRule:6:<img src="/file/view/LPOD-Nov...") |
|||
| Line 4: | Line 4: | ||
<!-- ws:start:WikiTextHeadingRule:0:<h1> --> | <!-- ws:start:WikiTextHeadingRule:0:<h1> --> | ||
<!-- ws:start:WikiTextLocalImageRule:6:<img src="/file/view/LPOD-Nov12-09.jpg/102042125/LPOD-Nov12-09.jpg" alt="" title="" /> -->[[File:LPOD-Nov12-09.jpg|LPOD-Nov12-09.jpg]]<!-- ws:end:WikiTextLocalImageRule:6 --><br /> | <!-- ws:start:WikiTextLocalImageRule:6:<img src="/file/view/LPOD-Nov12-09.jpg/102042125/LPOD-Nov12-09.jpg" alt="" title="" /> -->[[File:LPOD-Nov12-09.jpg|LPOD-Nov12-09.jpg]]<!-- ws:end:WikiTextLocalImageRule:6 --><br /> | ||
| − | <em>image created with [mailto:tychocrater@yahoo.com Chuck Wood]</em><br /> | + | <em>image created with [http://wms.selene.jaxa.jp/3dmoon/index.html Kaguya visualization viewer]</em><br /> |
| + | <br /> | ||
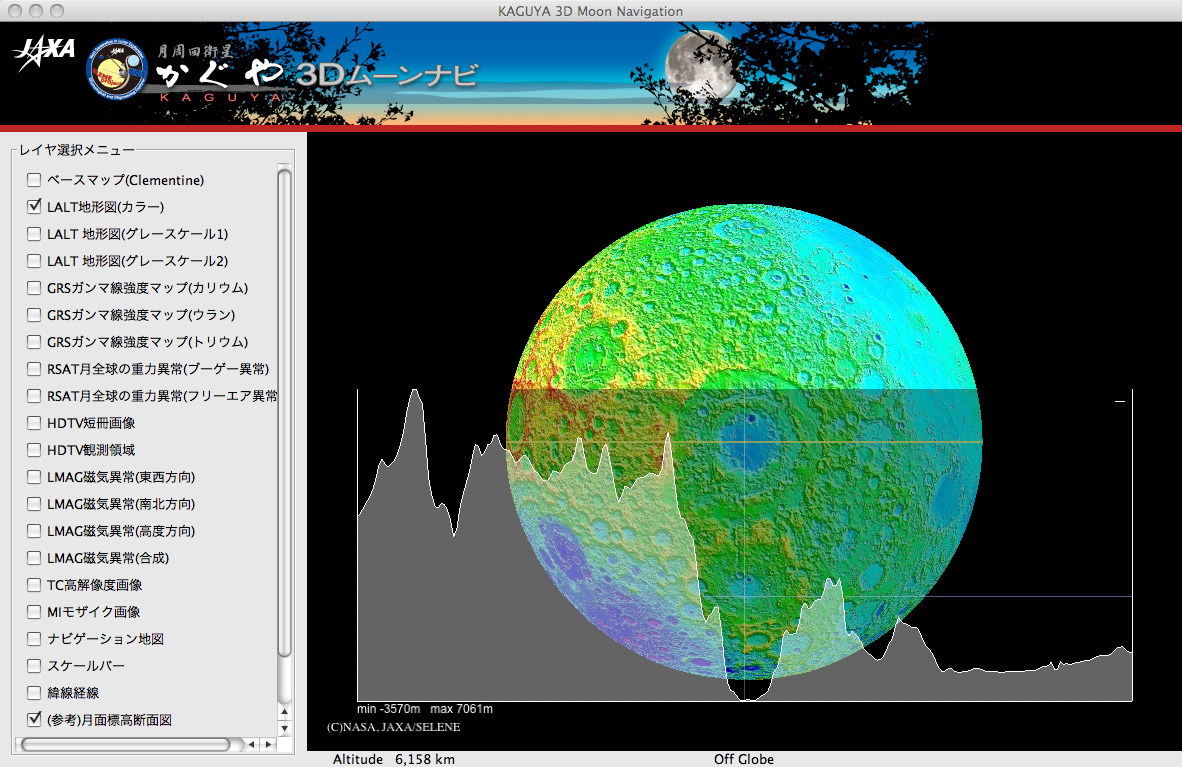
| + | The Kaguya science team has released some data from their mission and the future of data visualization is becoming clearer, but is still pretty hazy in part. This is a screen capture from a downloaded visualization program (based on NASA's [http://worldwindcentral.com/wiki/Main_page WorldWind]) that displays Kaguya's digital terrain data both as a colored image and as a cross section. The horizontal yellow line shows the track of the topo trace, but unfortunately the scale of the map and the cross section differ, making comparisons less certain. You can zoom in and out on the map (+ and - keys), and rotate it, but the cross-section always seems to be a different scale. Nonetheless, you can see the generally high elevation of the farside highlands (left), compared to the lower mare plains of southern Oceanus Procellarum (right). And right in the middle is the bull's eye basin of Orientale. Although the Cordillera Mountains bounding Orientale on the east look big, they are much lower than the indistinct, western rim. Orientale formed on a persistent downward slope from the farside to the nearside. You can read the elevation for any point on the map but they don't always seem believable. In some cases nearly adjacent points may have elevation differences of thousands of meters. The control panel on the left includes magnetic and other data that can easily be displayed, but the resolution seems poor - especially for the very few HDTV and Terrain Camera images. An English version of this interface will appear at the end of this month - perhaps there will be operations that I don't understand now. When all the image data (at high resolution) are displayable with elevations, magnetism, gravity and other measured quantities, desktop studies of the Moon will enter a new era. This will be as significant as going from printed maps and atlases to the Internet. The future is almost here.<br /> | ||
| + | <br /> | ||
| + | <em>[mailto:tychocrater@yahoo.com Chuck Wood]</em><br /> | ||
<br /> | <br /> | ||
<strong>Technical Details</strong><br /> | <strong>Technical Details</strong><br /> | ||
Revision as of 19:48, 1 January 2015
A Tidal Wave of Access - Almost
image created with Kaguya visualization viewer
The Kaguya science team has released some data from their mission and the future of data visualization is becoming clearer, but is still pretty hazy in part. This is a screen capture from a downloaded visualization program (based on NASA's WorldWind) that displays Kaguya's digital terrain data both as a colored image and as a cross section. The horizontal yellow line shows the track of the topo trace, but unfortunately the scale of the map and the cross section differ, making comparisons less certain. You can zoom in and out on the map (+ and - keys), and rotate it, but the cross-section always seems to be a different scale. Nonetheless, you can see the generally high elevation of the farside highlands (left), compared to the lower mare plains of southern Oceanus Procellarum (right). And right in the middle is the bull's eye basin of Orientale. Although the Cordillera Mountains bounding Orientale on the east look big, they are much lower than the indistinct, western rim. Orientale formed on a persistent downward slope from the farside to the nearside. You can read the elevation for any point on the map but they don't always seem believable. In some cases nearly adjacent points may have elevation differences of thousands of meters. The control panel on the left includes magnetic and other data that can easily be displayed, but the resolution seems poor - especially for the very few HDTV and Terrain Camera images. An English version of this interface will appear at the end of this month - perhaps there will be operations that I don't understand now. When all the image data (at high resolution) are displayable with elevations, magnetism, gravity and other measured quantities, desktop studies of the Moon will enter a new era. This will be as significant as going from printed maps and atlases to the Internet. The future is almost here.
Chuck Wood
Technical Details
Download the viewer software here by clicking on the Mac or Win button. Play with all the Japanese options in the menu bar at left and send LPOD any really neat data displays you create.
Coming Attractions
The next few LPODs will be stunning images from Kaguya/Selene. Make sure you are sitting down.
COMMENTS?
Click on this icon File:PostIcon.jpg at the upper right to post a comment.


