Difference between revisions of "November 26, 2012"
| Line 11: | Line 11: | ||
<br /> | <br /> | ||
<strong>Related Links</strong><br /> | <strong>Related Links</strong><br /> | ||
| − | Rükl plate [ | + | Rükl plate [https://the-moon.us/wiki/R%C3%BCkl+27 27]<br /> |
<em>[http://lpod.wikispaces.com/21st+Century+Atlas+of+the+Moon 21st Century Atlas]</em> chart 2.<br /> | <em>[http://lpod.wikispaces.com/21st+Century+Atlas+of+the+Moon 21st Century Atlas]</em> chart 2.<br /> | ||
F. Scholten, J. Oberst, K.-D. Matz, T. Roatsch, M. Wählisch, E. J. Speyerer, and M. S. Robinson (2012) [http://www.agu.org/pubs/crossref/2012/2011JE003926.shtml GLD100: The near-global lunar 100 m raster DTM from LROC WAC stereo image data.] <em>J. Geophys. Res.</em> Vol. 117, E00H17, doi:10.1029/2011JE003926, 2012<br /> | F. Scholten, J. Oberst, K.-D. Matz, T. Roatsch, M. Wählisch, E. J. Speyerer, and M. S. Robinson (2012) [http://www.agu.org/pubs/crossref/2012/2011JE003926.shtml GLD100: The near-global lunar 100 m raster DTM from LROC WAC stereo image data.] <em>J. Geophys. Res.</em> Vol. 117, E00H17, doi:10.1029/2011JE003926, 2012<br /> | ||
Revision as of 18:36, 18 August 2018
Fish Scales

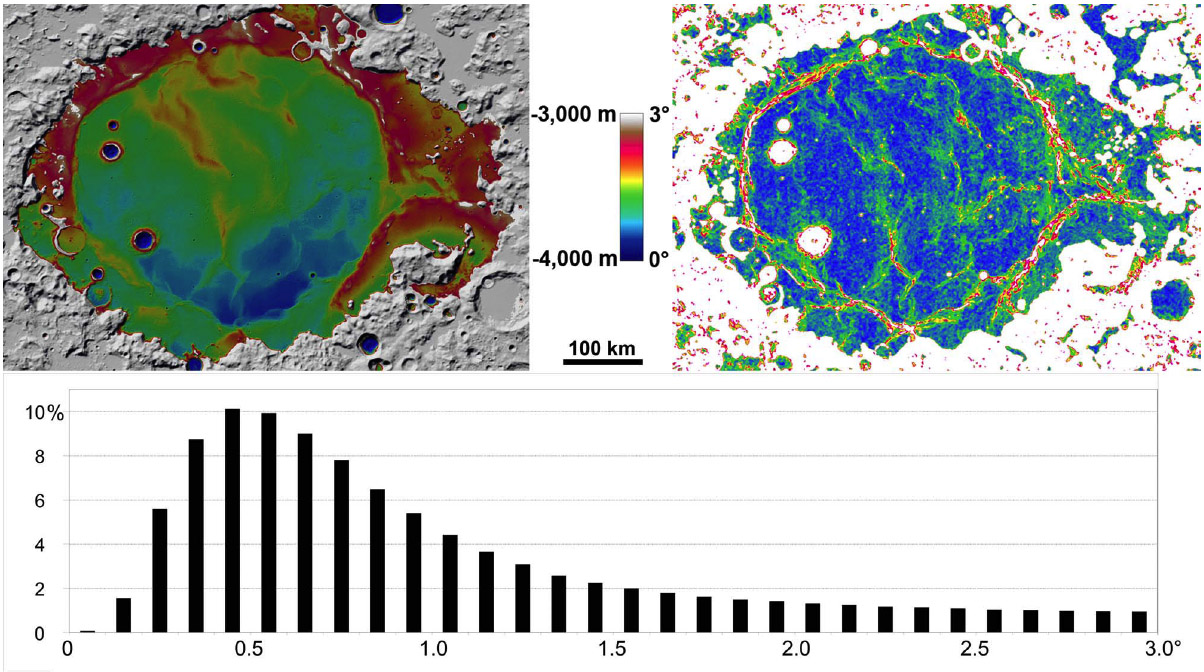
diagram from Scholten and LRO colleagues (2012)
I have always thought Mare Crisium looks like a fish swimming towards the west. The color in these maps of topography and slopes suggest that it is a tropical fish, perhaps an angelfish. These diagrams are wonderful examples of the new level of topographic detail that LRO provides, this time derived from stereo-determinations of altitude from overlapping LRO Wide Angle Camera (WAC) images. The top left image shows a 1000 m range of topography across the mare floor of the basin. The right side diagram, that maps out slopes between 0° and 3°, demonstrates that the edges of the high red bench in the left diagram are mare ridges, whose "steepness" is shown by red in the right image. The ridges are faults that dropped down the center of the mare by hundreds of meters. The entire mare tilts to the south, from the incomplete high annular bench (red) to the low area (blue) downdropped by southern mare ridges. The slope map shows that mare ridges, which topographically are very gentle rises, are actually noticeably steeper than mare surfaces, made smooth by the flowing of low-viscosity lavas. The histogram reveals the same thing, the average slope of Mare Crisium is only 0.5°. Finally, slope maps may be the definitive way to map out an entire basin's mare ridges, a valuable complement to low-sun telescopic images.
Chuck Wood
Related Links
Rükl plate 27
21st Century Atlas chart 2.
F. Scholten, J. Oberst, K.-D. Matz, T. Roatsch, M. Wählisch, E. J. Speyerer, and M. S. Robinson (2012) GLD100: The near-global lunar 100 m raster DTM from LROC WAC stereo image data. J. Geophys. Res. Vol. 117, E00H17, doi:10.1029/2011JE003926, 2012
Yesterday's LPOD: Areas of Confusion
Tomorrow's LPOD: Wishbook
COMMENTS?
Register, Log in, and join in the comments.


