Difference between revisions of "June 3, 2011"
(Created page with "__NOTOC__ =Ups And Downs but Are They Sound?= <!-- ws:start:WikiTextHeadingRule:0:<h1> --> <!-- ws:start:WikiTextLocalImageRule:6:<img src="/file/view/LPOD-J...") |
|||
| Line 6: | Line 6: | ||
<em>image by [mailto:mauricejscollins@hotmail.com Maurice Collins]</em><br /> | <em>image by [mailto:mauricejscollins@hotmail.com Maurice Collins]</em><br /> | ||
<br /> | <br /> | ||
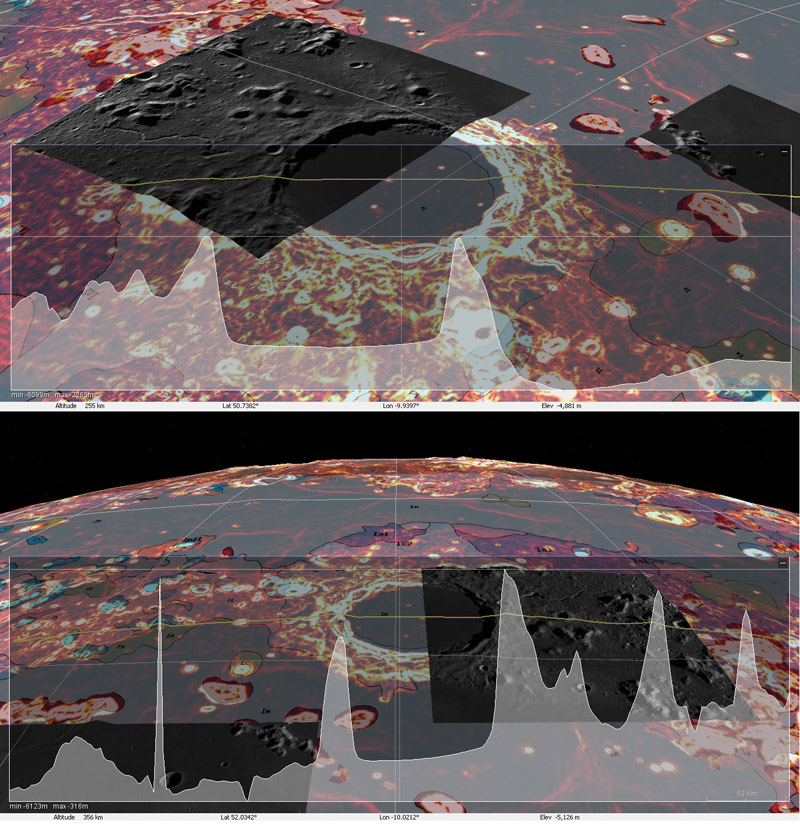
| − | Maurice, our intrepid lunar imaging explorer, is apparently one of the few to try out the new [mailto:tychocrater@yahoo.com Chuck Wood]</em><br /> | + | Maurice, our intrepid lunar imaging explorer, is apparently one of the few to try out the new [http://pub.lmmp.nasa.gov/LMMPUI/LMMP_CLIENT/LMMP.html Iliads] software mentioned in the LPOD of [http://lpod.armoredpenguin.com/wiki/May+16%2C+2011 May 16]. The monthful <em>Integrated Lunar Information Architecture for Decision Support</em> downloadable program allows combining of various data sets - here, Maurice used the LRO slope map and the USGS geology map as background with a few Kaguya images draped here and there, and a topographic cross-section passing across Plato. The top image shows a transect running approximately NE to SW, revealing a flat floor for Plato, which is significantly higher than nearby Mare Imbrium. The lower image is more surprising for it displays a significant down slope of Plato's floor from east to west. There doesn't seem to be a scale bar for the altimeter trace but estimating from the altitude of Plato's east rim above its floor (~2.5 km), the western side of Plato's floor is about 200 m lower than the east side. Is that true? Possibly, but some of the other topography here looks questionable, especially the unimposing [http://www.lpod.org/?m=20070107 hillock] to the west that maps as a towering spire on the altimetry. We all need to look closely at Iliads to understand any limitations or errors in the software or data. It looks like it can be a very good analysis tool, once it is better understood.<br /> |
| + | <br /> | ||
| + | <em>[mailto:tychocrater@yahoo.com Chuck Wood]</em><br /> | ||
<br /> | <br /> | ||
<strong>Related Links</strong><br /> | <strong>Related Links</strong><br /> | ||
Revision as of 20:43, 1 January 2015
Ups And Downs but Are They Sound?
image by Maurice Collins
Maurice, our intrepid lunar imaging explorer, is apparently one of the few to try out the new Iliads software mentioned in the LPOD of May 16. The monthful Integrated Lunar Information Architecture for Decision Support downloadable program allows combining of various data sets - here, Maurice used the LRO slope map and the USGS geology map as background with a few Kaguya images draped here and there, and a topographic cross-section passing across Plato. The top image shows a transect running approximately NE to SW, revealing a flat floor for Plato, which is significantly higher than nearby Mare Imbrium. The lower image is more surprising for it displays a significant down slope of Plato's floor from east to west. There doesn't seem to be a scale bar for the altimeter trace but estimating from the altitude of Plato's east rim above its floor (~2.5 km), the western side of Plato's floor is about 200 m lower than the east side. Is that true? Possibly, but some of the other topography here looks questionable, especially the unimposing hillock to the west that maps as a towering spire on the altimetry. We all need to look closely at Iliads to understand any limitations or errors in the software or data. It looks like it can be a very good analysis tool, once it is better understood.
Chuck Wood
Related Links
Rükl plate 3
COMMENTS?
Click on this icon File:PostIcon.jpg at the upper right to post a comment.


