October 25, 2009
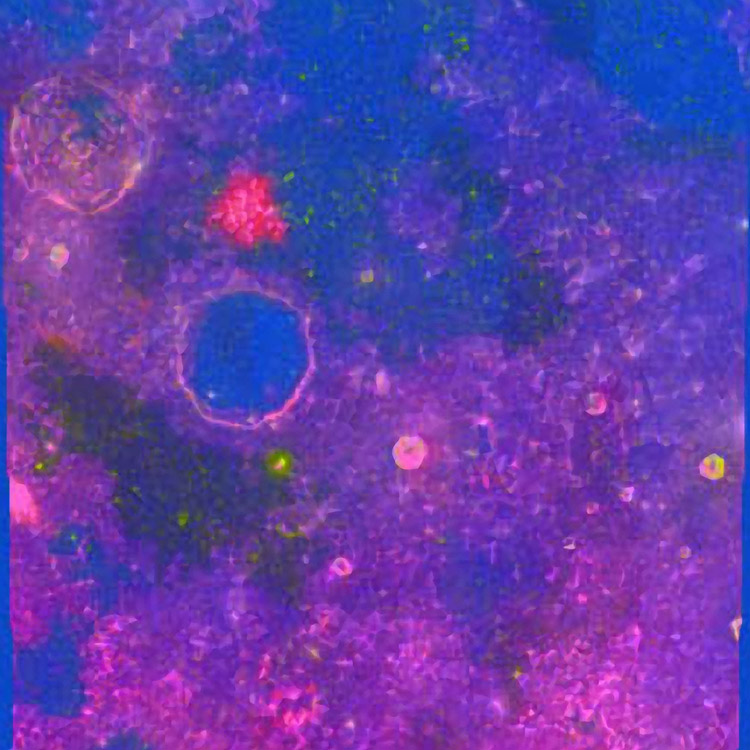
Red Arrowhead

image by Rick Evans
I created this image of Mons Hansteen, a lunar red spot, by performing principal component image analysis (PCA) on the five Clementine UVVIS multispectral band images (i.e. 415, 750, 900, 950 and 1000 nm). PCA is a tool sometimes used in multispectral geology studies to reveal variations in mineral composition. Using Photoshop the Clementine images were loaded respectively into five alpha channels of a color image with the R, G and B channels deleted. With all alpha channels selected, FoveaPro 4.0 software was used to create a PCA transform and then to transform the alpha channel images into their respective principal component images. The first three resulting PCA images were then loaded respectively into the R, G and B channels of a color image producing the final image shown above. Mons Hansteen and all other lunar red spot features show up with a very distinctive reddish hue in such images. Lunar red spots seem to absorb preferentially in the ultraviolet region of the spectrum compared to the visible; other lunar mafic features including the central peaks of Tycho are fascinating to observe with this technique as well.
Rick Evans
Lunar History Note: Today is the 184th birthday of perhaps the greatest selenographer of the 19th century -J.F. Julius Schmidt (1825-1884). Thanks to Mark Tillotson for the reminder!
Related Links
Rükl plate 40


